Rescue Nitrogen Applications to Corn
Crop Insights written by Dan Emmert, Agronomy Trials Manager
Zimmerman Ag Service | 620-440-7780
Crop Insights written by Dan Emmert, Agronomy Trials Manager
Nitrogen (N) is essential to plant growth. As a constituent of protein, it is instrumental in critical plant functions from germination to senescence. As a component of the chlorophyll molecule, nitrogen has a primary role in photosynthesis and therefore yield accumulation in crops. Unfortunately, this critical plant nutrient can be easily lost from the soil by leaching or denitrification when excessive rainfall occurs (Figure 1).
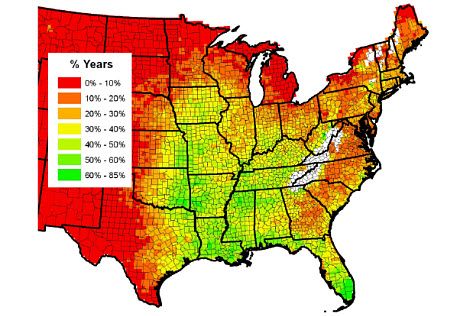
Figure 1. Percent of years with greater than 14 inches of precipitation from April through June. Spring N losses are more common in higher rainfall areas (green on map¹).
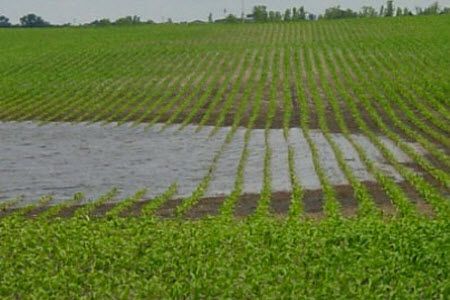
Figure 2. Heavy rainfall and low-lying areas are a combination that can lead to N losses by the process of denitrification.
When early-season N losses occur, or wet conditions prevent applying N early, rescue applications can be an effective remedy for corn producers. Another benefit to late application is the reduced risk of N loss and increased likelihood of N availability when the corn crop needs it most. This Crop Insights will discuss evaluating N losses, best practices for rescue N applications and expected corn response. Prior articles in this N-management series have discussed N rates (Shanahan, 2011) and N timing (Butzen, 2011).
Wet conditions in May and June can delay planned sidedress applications as well as promote losses of previously applied nitrogen. When this occurs, producers must decide if an additional N application is warranted to avoid the risk of reduced yield. Recent wet springs and resulting yield losses demonstrate the importance of making the correct decision.
When determining whether or not to apply additional N, producers should evaluate how much N remains in the soil and decide if that will be enough to meet crop needs. If not, a rescue N application may be needed.
There are several ways to evaluate N losses after excessive rainfall events:
Soil Tests
Soil tests can be a useful tool for helping to determine supplemental N needs in the spring, even though the predictive value of these tests is affected by weather conditions that impact N losses and mineralization. Because of wet spring conditions in broad areas of the Corn Belt in recent years, several universities have written articles on use of soil sampling to help determine N loss and crop needs. See list below.
University resources for determining N loss.
Local conditions, including soil type, drainage characteristics and average temperature and rainfall greatly affect N-loss potential. For this reason, growers are encouraged to review their own state's recommendations.
When soil sampling for N, it is important that samples be taken to a depth of at least 12 inches. This is because heavy rains can move nitrate deeper into the soil profile, so sampling to a depth greater than 12 inches may provide a better idea of how much nitrate remains in the root zone. After collecting the samples they should be frozen or spread out to air-dry before being sent to a reliable soil lab.
Of all soil-testing procedures for N, the test most commonly recommended and used is the Pre-Sidedress Nitrate Test (PSNT), also known as the Late Spring Soil Nitrate Test (LSNT) (Camberato and Nielsen, 2010). However, this test also has limitations and specific applications, so adjustments may be required. The test was originally designed to estimate the amount of N available in fields where manure has been applied or a legume such as alfalfa or clover has been plowed down. In these situations, the test is an indicator of how much N is currently available and how much is expected to be released. Because of this, the critical level may need to be adjusted above 25 ppm when using the PSNT for determining N availability following heavy rains.
Optical Sensors
Recently improved optical sensors can help assess N deficiency and the amount of N needed to optimize crop response (Shanahan, 2010). These crop sensors, mounted on N-application equipment, work by emitting modulated light of the appropriate wavelength onto plants then measuring how much of that light is reflected back to the sensor. This measure of “crop greenness” correlates with plant chlorophyll content. Estimating chlorophyll content also estimates crop N status, as the two are closely linked.
The sensing and application process begins by calibrating the sensor using a sufficiently fertilized “reference strip” area of the field. First, sensor readings are collected from the well-fertilized area and the values are recorded in an on-board computer. Then, as the applicator traverses the rest of the field, the sensing, rate calculations and application all occur at once. For more detailed information concerning crop sensors, read the Crop Insights on this subject.
In addition to crop sensors, aerial imagery and chlorophyll meters are also good tools for evaluating the N needs of a growing corn crop.
Estimating N Loss
In lieu of soil testing or crop sensing, nitrogen loss can be estimated, and this estimate used as a basis for deciding if more nitrogen should be applied. When estimating N loss the key questions to answer are:
Greater quantities of N fertilizer are converted to nitrate as time goes by and soil temperatures increase. Knowing when the N was applied and what fertilizer was used enables the estimation of the quantity of N in the nitrate form when rainfall occurred (Table 1).
Table 1. Amount of nitrogen fertilizer in the nitrate-N form 0, 3 and 6 weeks after application.
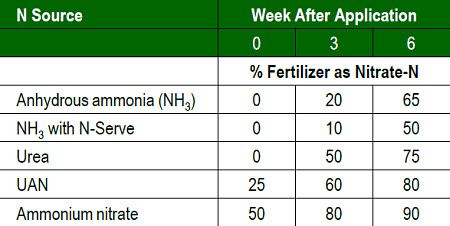
Adapted from Lee et al., 2007.
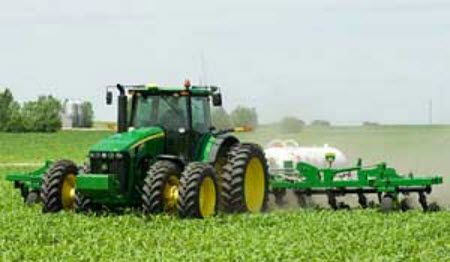
Figure 3. Anhydrous ammonia applied just prior to periods of prolonged soil saturation is less prone to denitrification than urea or UAN. Photo courtesy of Deere & Company.
Just because N was in the nitrate form does not mean all of it was lost. The soil temperature and duration of soil saturation are two key factors affecting denitrification. The warmer the soil and the longer it was saturated both increase denitrification losses (Table 2).
Table 2. Estimated denitrification losses as influenced by soil temperature and days of saturation.
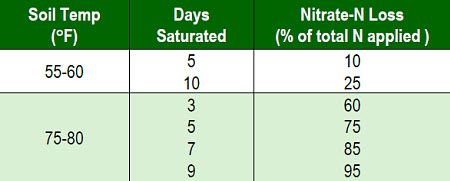
From Bremner and Shaw, 1958.
Another way to estimate whether a rescue N application is needed is to use the Nitrogen Loss Scoresheet developed at the University of Missouri (Scharf, 2008). After estimating the amount of nitrate lost by either method above, a better decision can be made as to whether a rescue N application is needed and how much additional N is required.
Options for rescue N application are limited compared to earlier season N applications. Equipment availability and N source are the two most important factors to consider when deciding which form of N to use. Other factors to be concerned about are the risk of leaf injury and the potential for NH3 volatilization from urea application.
If a high-clearance sprayer is available, banded applications of urea ammonium nitrate (UAN) solution can be made. Make sure the sprayer is equipped with weighted hoses that will drag the ground. This will help to prevent the hoses from riding up on the leaves, which results in splatter and leaf burn. A banded application will also help to minimize urea hydrolysis and volatilization.
If choosing to broadcast the rescue N, urea is the product of choice. This is because other N sources – ammonium nitrate (NH4NO3) and UAN solution – cause extensive leaf burning when broadcast (Figure 4). Studies have shown that this leaf injury often results in yield loss. Urea is much safer to broadcast, usually resulting in only minimal crop injury, as Figure 1 indicates (Nelson et al., 2011).
However, urea is subject to NH3 volatilization. The use of NBPT (N-(n-butyl) thiophosphoric triamide), a urease inhibitor, can help prevent urea hydrolysis and subsequent NH3 volatilization. Banded applications also will help minimize N loss. Late applications of controlled-release urea are not recommended because of the delay between application and the N being released and available to the corn.
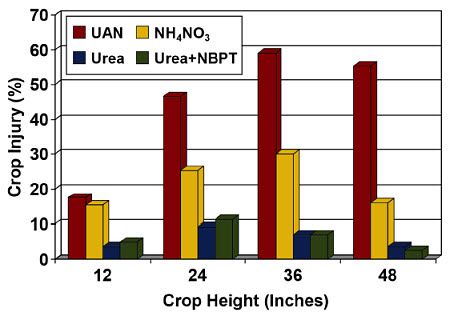
Figure 4. Leaf injury caused by broadcast application of nitrogen sources to corn at different plant heights. Source: Nelson et al., 2010.
When making rescue nitrogen applications it is important to remember that in many situations where N loss occurred, prolonged soil saturation and/or ponding likely lowered corn yield potential. As a result, full N rates may no longer be needed. Also, because N losses were probably greatest in the low-lying areas of the field, whole-field rescue applications may not make sense. Applying additional N to areas that do not need it will only result in increased time and costs and little increase in yield.
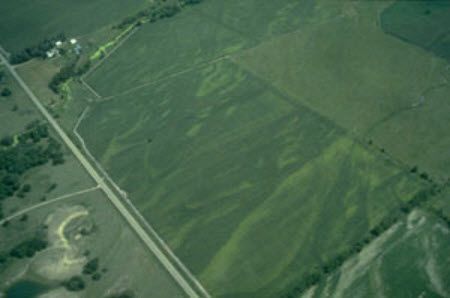
Figure 5. Aerial view of corn field showing areas of severe N deficiency due to excessive rainfall and leaching of nitrogen.
The greater the N deficiency and the longer it goes uncorrected, the greater the potential for yield loss. The sooner the N is applied, the more responsive the corn is likely to be. Early-season N stress can result in irreversible yield loss (Binder et al., 2000). This is due in part to a reduction in the number of kernel rows per ear, which is determined when ear shoots are set, usually between V5 and V8 (Strachan, 2004). If the deficiency is not corrected, yield loss is inevitable. On the other hand, rescue N applications prior to tasseling have proven to be effective at recovering yield, as these research studies indicate:
These studies clearly show that rescue applications during the late vegetative stages can result in increased yields and economic returns. However, it is important to remember that dry conditions after the rescue N application can limit the effectiveness of additional N because water is needed to move N into the root zone.
Finally, nitrogen applications after R1 (silking) are generally not encouraged, as some studies have shown that economic yield response to N fertilization seldom occurs after pollination. However, under severe N deficiency, some response may occur to applications of low rates of N (30 to 60 pounds) as late as three weeks after pollination (Thomison, 2010).
Acknowledgement
1 The author gratefully acknowledges John Shanahan and Wade Givens for providing the precipitation map (Figure 1).